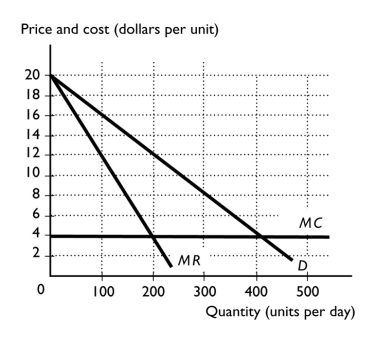
-The figure above shows a the market demand curve for a market with three firms.It also shows a firm's marginal cost curve.In this oligopoly,what is the range of output and prices? Why does this range of outcomes exist?
Correct Answer:
Verified
View Answer
Unlock this answer now
Get Access to more Verified Answers free of charge
Q164: What is the conclusion in the prisoners'
Q171: The range of output for a duopoly
Q187: In the Boeing/Airbus oligopoly example discussed in
Q197: What is the legal status of a
Q198: What three characteristics do all games have
Q205: In a cartel,how does the number of
Q231: Describe the characteristics of an oligopoly.
Q236: "Because firms in an oligopoly are so
Q240: What market structures other than oligopoly have
Q245: OPEC, the Organization of Petroleum Exporting Countries,
Unlock this Answer For Free Now!
View this answer and more for free by performing one of the following actions

Scan the QR code to install the App and get 2 free unlocks

Unlock quizzes for free by uploading documents