Multiple Choice
The figure illustrates the 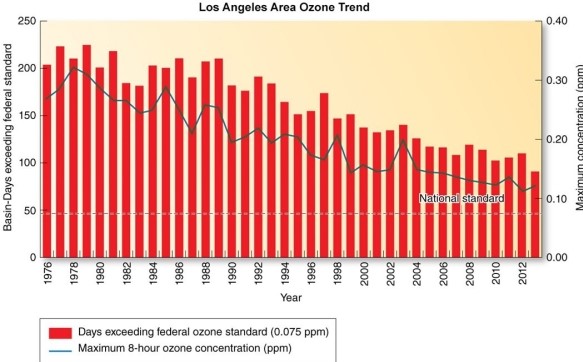
A) downward trend in the frequency of radiation inversions in the Los Angeles area.
B) consistent improvement in Los Angeles area air quality.
C) downward trend in the frequency of subsidence inversions in the Los Angeles area.
D) increasing trend in pollutant dispersion in the Los Angeles area.
Correct Answer:
Verified
Related Questions
Q64: This type of air leads to the
Q65: Which of the following vertical temperature profiles
Q66: Great wind speeds favor
A)increased horizontal dispersion.
B)increased vertical

Unlock this Answer For Free Now!
View this answer and more for free by performing one of the following actions

Scan the QR code to install the App and get 2 free unlocks

Unlock quizzes for free by uploading documents