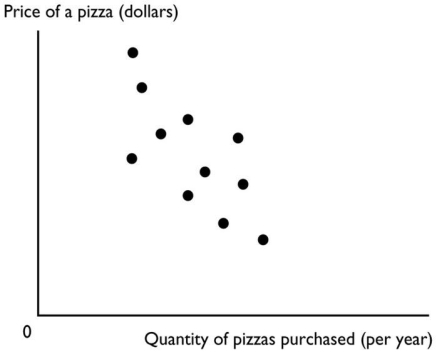
The figure above shows a
A) slope.
B) time-series graph.
C) cross-section graph.
D) scatter diagram.
E) trend diagram.
Correct Answer:
Verified
Q136: When the Adelaide Crows score more than
Q137: John has two hours of free time
Q138: Which of the following statements is a
Q139: Which of the following statements is a
Q140: The _ of something is the gain
Q142: Most economic graphs have two lines perpendicular
Q143: A graph of the value of one
Q144: A graph shows the wage rate of
Q145: Which of the following is a positive
Q146: A time-series graph displays the price of
Unlock this Answer For Free Now!
View this answer and more for free by performing one of the following actions

Scan the QR code to install the App and get 2 free unlocks

Unlock quizzes for free by uploading documents