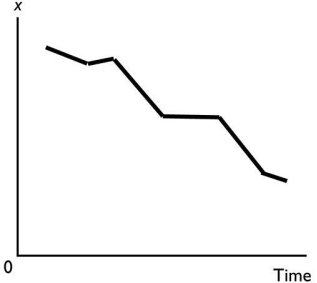
In the above figure,the diagram shows
A) a scatter diagram.
B) a two-variable scatter diagram.
C) a downward trend in x.
D) an upward trend in x.
E) a cross-section graph between x and time.
Correct Answer:
Verified
Q100: A linear relationship
A)can be a positive or
Q168: _ shows the values of a variable
Q170: A graph that shows how the amount
Q171: As a person increases his or her
Q172: A positive relationship exists between two variables
Q174: You have data for the amount of
Q175: A graph that shows the value of
Q176: To show the values of an economic
Q177: A graph shows the average ATAR scores
Q178: Demonstrating how an economic variable changes from
Unlock this Answer For Free Now!
View this answer and more for free by performing one of the following actions

Scan the QR code to install the App and get 2 free unlocks

Unlock quizzes for free by uploading documents