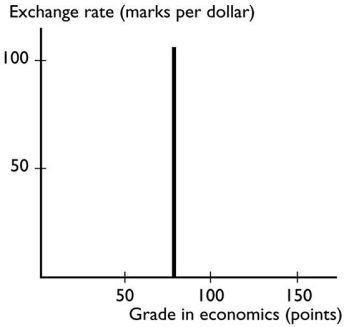
The graph shows
A) no relationship between the variables.
B) a trend relationship between the variables.
C) a positive relationship that is linear.
D) a negative relationship that is linear.
E) a positive relationship that becomes less steep.
Correct Answer:
Verified
Q208: A graph of the relationship between two
Q209: Q210: A slope is measured as the Q211: Q214: If a curve falls and then rises,it Q215: Moving from left to right,a U-shaped curve Q216: A slope is measured as the Q217: If,whenever one variable increases,another variable also increases,then Q220: The minimum point of a U-shaped curve, Q228: Unlock this Answer For Free Now! View this answer and more for free by performing one of the following actions Scan the QR code to install the App and get 2 free unlocks Unlock quizzes for free by uploading documents![]()
A)value of![]()
A)has
A)value of
A)![]()

