Multiple Choice
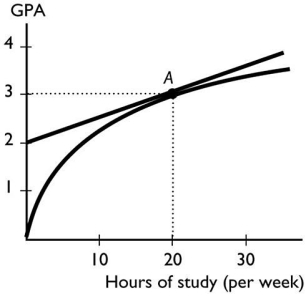
The figure above shows the relationship between the time a student spends studying and the student's GPA that semester.The slope of the relationship at point A equals
A) 1/20.
B) 3/20.
C) 3.
D) 0.
E) 2/20.
Correct Answer:
Verified
Related Questions

