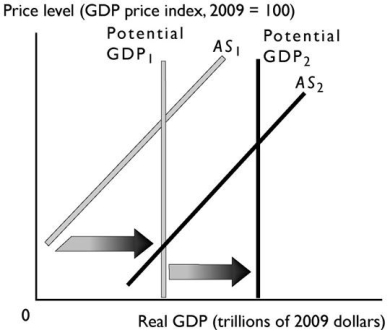
The change in potential real GDP and aggregate supply shown in the graph above can be a result of
A) a decrease in the money price of oil.
B) an increase in the real wage rate.
C) a fall in the price level.
D) a decrease in the money wage rate.
E) an increase in the quantity of capital.
Correct Answer:
Verified
Q26: Aggregate demand _ if the expected inflation
Q28: Which of the following produces a movement
Q30: A rise in the money wage rate
Q36: A technological advance _ aggregate supply, shifting
Q51: The government passes a law which doubles
Q52: Which of the following best describes the
Q54: A fall in the money wage rate
Q57: When potential GDP increases,the potential GDP line
Q58: An increase in the price of oil
Q59: ![]()
Unlock this Answer For Free Now!
View this answer and more for free by performing one of the following actions

Scan the QR code to install the App and get 2 free unlocks

Unlock quizzes for free by uploading documents