Multiple Choice
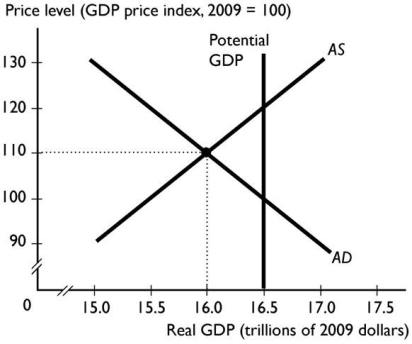
-In the figure above,the economy is at an equilibrium with real GDP of $16 trillion and a price level of 110.As the economy moves toward its ultimate equilibrium,the ________ curve shifts ________.
A) potential GDP;leftward
B) aggregate supply;rightward
C) aggregate demand;leftward
D) aggregate demand;rightward
E) aggregate supply;leftward
Correct Answer:
Verified
Related Questions

