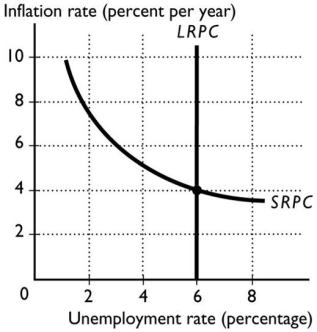
-In the figure above,the expected inflation rate is
A) 2 per cent.
B) 0 per cent.
C) 8 per cent.
D) 6 per cent.
E) 4 per cent.
Correct Answer:
Verified
Q25: Q27: The short-run Phillips curve shows _ between Q29: In order to keep the real wage Q32: When the aggregate demand curve shifts rightward, Q35: If the economy is at full employment, Q60: The curve that shows the relationship between Q61: Hungry Jacks is paying $9 an hour Q65: In the long run,the inflation rate Q66: The short-run Phillips curve is downward sloping Q68: The lack of a long-run tradeoff between![]()
A)is zero.
B)can
Unlock this Answer For Free Now!
View this answer and more for free by performing one of the following actions

Scan the QR code to install the App and get 2 free unlocks

Unlock quizzes for free by uploading documents