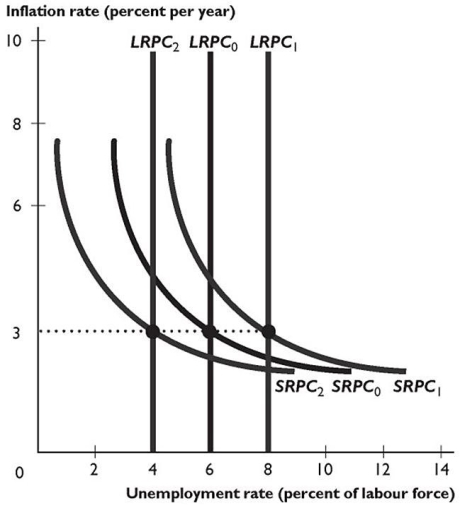
The figure above shows some Phillips curves for an economy.
-In the figure above,the shift from the short-run Phillips curve SRPC₀ and the long-run Phillips curve LRPC0 to the short-run Phillips curve SRPC₁
And the long-run Phillips curve LRPC1 is the result of ________ in the expected inflation rate and ________ in the natural unemployment rate.
A) an increase;an increase
B) no change;an increase
C) a decrease;a decrease
D) an increase;no change
E) a decrease;no change
Correct Answer:
Verified
Q41: Q58: Both the long-run and the short-run Phillips Q98: Q100: If the expected inflation rate changes,the long-run Q101: When people use all the relevant data Q102: The baby boomers born in the 1940s Q104: When the natural unemployment rate increases,the short-run Q106: The expected inflation rate is the Q107: Q108: Unlock this Answer For Free Now! View this answer and more for free by performing one of the following actions Scan the QR code to install the App and get 2 free unlocks Unlock quizzes for free by uploading documents![]()
![]()
A)rate that![]()
![]()

