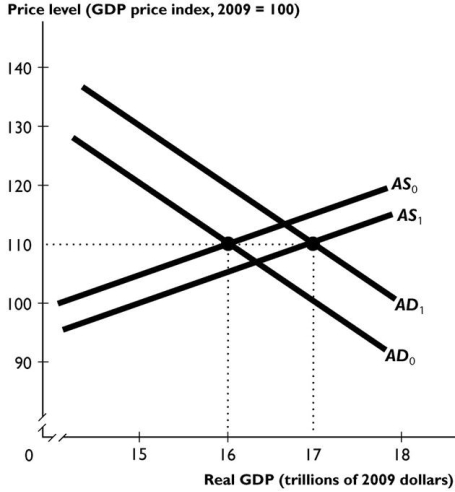
The figure above shows an economy's aggregate demand curve and aggregate supply curve.
-Suppose the shift from AD₀ to AD₁ and from AS₀ to AS₁ is the result of fiscal policy.If the effect on aggregate demand was larger than the figure above shows,as a result the price level would be ________ 110 and real GDP would be ________ $17 trillion.
A) higher than;larger than
B) smaller than;larger than
C) equal to;larger than
D) equal to;equal to
E) smaller than;less than
Correct Answer:
Verified
Q62: If a tax cut increases aggregate demand
Q68: If the income tax rate is 20
Q75: If fiscal stimulus creates a large budget
Q137: When taxes are cut,aggregate demand _ and
Q139: When the government cuts the income tax
Q140: The standard view in economics is that
Q142: The interest rate tax wedge _ the
Q143: A government budget deficit _ the _
Q145: Q146: ![]()
![]()
Unlock this Answer For Free Now!
View this answer and more for free by performing one of the following actions

Scan the QR code to install the App and get 2 free unlocks

Unlock quizzes for free by uploading documents