Multiple Choice
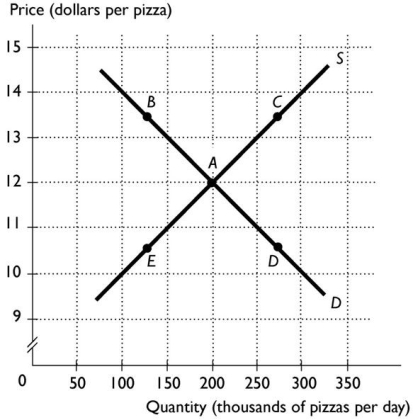
-The above figure shows the market for pizza.The market is in equilibrium.Pizza and tacos are substitutes for consumers.The price of tacos falls.Which point represents the most likely new price and quantity?
A) A
B) B
C) C
D) D
E) E
Correct Answer:
Verified
Related Questions

