Multiple Choice
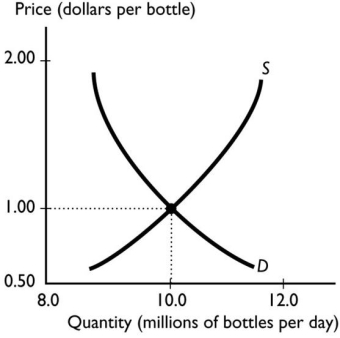
-The graph above illustrates the market for bottled water.If the producers of bottled water switch to using improved technology,then the
A) price of bottled water rises.
B) supply curve shifts leftward.
C) quantity demanded of bottled water does not change.
D) quantity demanded of bottled water increases.
E) supply of bottled water decreases.
Correct Answer:
Verified
Related Questions

