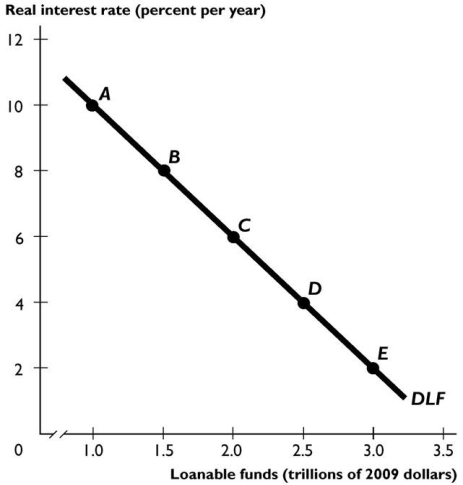
The figure above shows the demand for loanable funds curve.
In the figure above,a movement from point A to point C can be the result of
A) an increase in the government budget deficit.
B) a rise in the real interest rate.
C) an increase in expected profit.
D) a fall in the real interest rate.
E) a decrease in expected profit.
Correct Answer:
Verified
Q42: Q48: If expected profit falls, the demand for Q49: Q57: Q101: Suppose firms become more optimistic about the Q103: If the real interest rate is less Q104: Suppose that there is an increase in Q105: When the real interest rate _ the Q109: For a government to add to the Q111: Unlock this Answer For Free Now! View this answer and more for free by performing one of the following actions Scan the QR code to install the App and get 2 free unlocks Unlock quizzes for free by uploading documents![]()
![]()
![]()
![]()

