Figure 13-4A
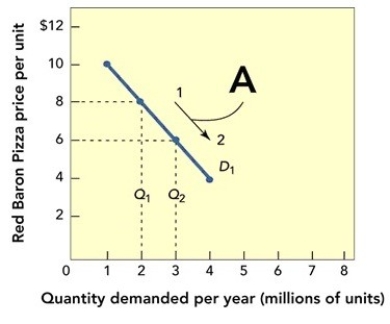
-Figure 13-4A above shows that when the price for Red Baron frozen cheese pizzas moves from $8 to $6 per unit along the demand curve D₁,the profit
A) increases from 6 to 8 million units per year.
B) decreases from 8 to 6 million units per year.
C) stays the same.
D) increases from $2 to $3 per unit.
E) cannot be determined;demand curves do not show a relationship to profit.
Correct Answer:
Verified
Q106: If competitive market circumstances are such that
Q121: Companies must know or anticipate what specific
Q126: The horizontal axis of a demand curve
Q129: All of the following are legal or
Q130: Florida Power & Light,an electric power company,is
Q132: Figure 13-3 Q135: Figure 13-3 Q136: The vertical axis of a demand curve Q137: A demand curve graph typically appears as Q138: Figure 13-3 Unlock this Answer For Free Now! View this answer and more for free by performing one of the following actions Scan the QR code to install the App and get 2 free unlocks Unlock quizzes for free by uploading documents
![]()
![]()
A)
![]()

