Essay
Figure 9.3 
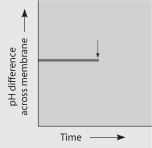
-The graph here shows the pH difference across the inner mitochondrial membrane over time in an actively respiring cell. At the time indicated by the vertical arrow, a metabolic poison is added that specifically and completely inhibits all function of mitochondrial ATP synthase. Draw what you would expect to see for the rest of the graphed line.
Correct Answer:
Verified
Related Questions
Q80: What is the purpose of beta oxidation

