The graph in Figure 22.3 depicts four possible patterns for the abundance of 3TC-resistant HIV within an infected human over time.
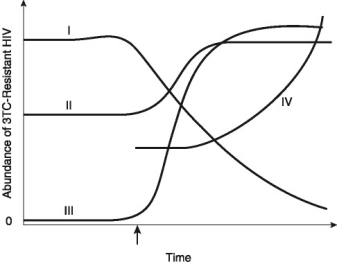
-If 3TC resistance is costly for HIV, then which plot (I-IV) best represents the response of a strain of 3TC-resistant HIV over time, if 3TC administration begins at the time indicated by the arrow?
A) I
B) II
C) III
D) IV
Correct Answer:
Verified
Q32: The following questions refer to the evolutionary
Q33: During drought years on the Galapagos, small,
Q34: The following questions refer to the evolutionary
Q36: To observe natural selection's effects on a
Q38: The following questions refer to the evolutionary
Q39: Of the following anatomical structures, which is
Q40: The following questions refer to the evolutionary
Q42: Structures as different as human arms, bat
Q50: The following questions refer to the evolutionary
Q53: The upper forelimbs of humans and bats
Unlock this Answer For Free Now!
View this answer and more for free by performing one of the following actions

Scan the QR code to install the App and get 2 free unlocks

Unlock quizzes for free by uploading documents