The data were collected from the heterocytes of a nitrogen-fixing cyanobacterium inhabiting equatorial ponds. Study the graph below and choose the most likely explanation for the shape of the curve. 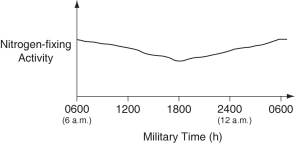
A) Enough O₂ enters heterocytes during hours of peak photosynthesis to have a somewhat-inhibitory affect on nitrogen fixation.
B) Light-dependent reaction rates must be highest between 1800 hours and 0600 hours.
C) Atmospheric N₂ levels increase at night because plants are no longer metabolizing this gas, so are not absorbing this gas through their stomata.
D) Heterocyte walls become less permeable to N₂ influx during darkness.
E) The amount of fixed nitrogen that is dissolved in the pond water in which the cyanobacteria are growing peaks at the close of the photosynthetic day (1800 h) .
Correct Answer:
Verified
Q27: Carl Woese and collaborators identified two major
Q33: Assuming that each of these possesses a
Q37: Which of the following obtain energy by
Q51: Match the numbered terms to the descriptions
Q54: Only certain prokaryotes can perform nitrogen fixation,
Q55: Match the numbered terms to the descriptions
Q57: Mitochondria are thought to be the descendants
Q58: Cyanobacteria are
A)photoautotrophs.
B)photoheterotrophs.
C)chemoautotrophs.
D)chemoheterotrophs that perform decomposition.
E)parasitic chemoheterotrophs.
Q60: Which statement about the domain Archaea is
Q61: A fish that had been salt-cured subsequently
Unlock this Answer For Free Now!
View this answer and more for free by performing one of the following actions

Scan the QR code to install the App and get 2 free unlocks

Unlock quizzes for free by uploading documents