 Figure 39.1
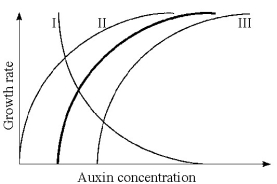
-The heavy line in Figure 39.1 illustrates the relationship between auxin concentration and cell growth in stem tissues. If the same range of concentrations were applied to lateral buds, what curve would probably be produced?
A) I
B) II
C) III
D) II and III
E) either I or III
Correct Answer:
Verified
Q23: Which plant hormones might be used to
Q24: Oat seedlings are sometimes used to study
Q25: How does indoleacetic acid affect fruit development?
A)preventing
Q26: Which of the following has not been
Q29: According to the acid growth hypothesis, auxin
Q30: Why might animal hormones function differently from
Q32: Cells elongate in response to auxin. All
Q34: Auxins (IAA)in plants are known to affect
Q39: Which of the following hormones would be
Q84: This experiment suggests that the unknown amount
Unlock this Answer For Free Now!
View this answer and more for free by performing one of the following actions

Scan the QR code to install the App and get 2 free unlocks

Unlock quizzes for free by uploading documents