Which of the following graphs illustrates the growth curve of a small population of rodents that has grown to reach a static carrying capacity?
A) 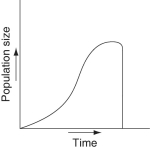
B) 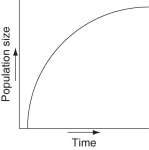
C) 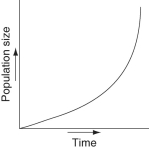
D) 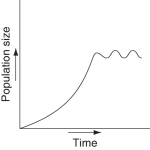
E) 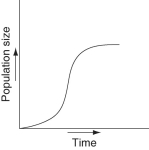
Correct Answer:
Verified
Q39: Which of the following statements about the
Q49: Which of the following graphs illustrates the
Q50: Your friend comes to you with a
Q51: Which of the following can contribute to
Q53: Which of the following is an incorrect
Q55: Field observation suggests that populations of a
Q56: Pacific salmon or annual plants illustrate which
Q57: The life history traits favored by selection
Q58: Density-dependent factors are related to which of
Q59: Which of the following characterizes relatively K-selected
Unlock this Answer For Free Now!
View this answer and more for free by performing one of the following actions

Scan the QR code to install the App and get 2 free unlocks

Unlock quizzes for free by uploading documents