Multiple Choice
Figure 24-4 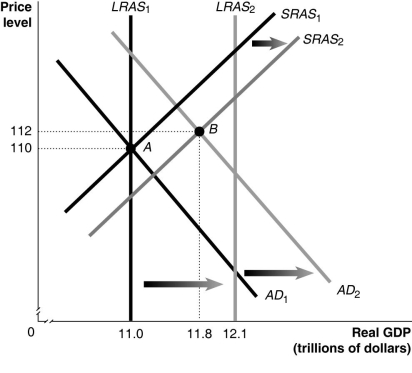
-Refer to Figure 24-4.In the figure above,LRAS1 and SRAS1 denote LRAS and SRAS in year 1,while LRAS2 and SRAS2 denote LRAS and SRAS in year 2.Given the economy is at point A in year 1,what is the growth rate in potential GDP in year 2?
A) 8%
B) 9.1%
C) 10%
D) 12%
Correct Answer:
Verified
Related Questions
Q202: At a long-run macroeconomic equilibrium,real GDP is
Q204: Stagflation occurs when short-run aggregate supply decreases.
Q205: Why does the short-run aggregate supply curve
Q207: Explain how the economy moves back to
Q210: At a short-run macroeconomic equilibrium,real GDP is
Q219: _ of unemployment during _ make it
Q221: As the recession persisted into 2009,the unemployment

