Figure 27-4
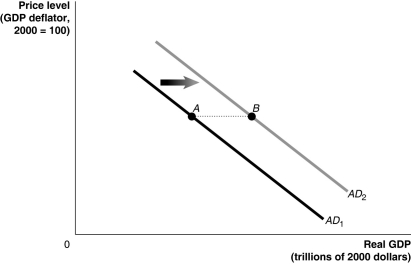
-Refer to Figure 27-4.In the graph above,the shift from AD1 to AD2 represents the total change in aggregate demand.If government purchases increased by $50 billion,then the distance from point A to point B ________ $50 billion.
A) would be equal to
B) would be greater than
C) would be less than
D) may be greater than or less than
Correct Answer:
Verified
Q59: Figure 27-2 Q60: Figure 27-2 Q65: Expansionary fiscal policy involves increasing government purchases Q83: Does expansionary fiscal policy directly increase the Q105: If real equilibrium GDP is above potential Q121: If the tax multiplier is -1.5 and Q125: Economists refer to the series of induced Q128: Suppose the government spending multiplier is 2.The Q130: The tax multiplier is smaller in absolute Q136: The aggregate demand curve will shift to
![]()
![]()
Unlock this Answer For Free Now!
View this answer and more for free by performing one of the following actions

Scan the QR code to install the App and get 2 free unlocks

Unlock quizzes for free by uploading documents