Figure 2-8
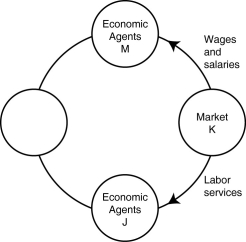
-Refer to Figure 2-8.One segment of the circular flow diagram in the figure shows the flow of wages and salaries from market K to economic agents M.What is market K and who are economic agents M?
A) K = factor markets; M = households
B) K = product markets; M = households
C) K = factor markets; M = firms
D) K = product markets; M = firms
Correct Answer:
Verified
Q106: Table 2-5 Q181: The natural resources used in production are Q183: The resource income earned by those who Q190: An example of a factor of production Q195: Is it possible for a firm to Q200: If a commercial dairy farm wants to Q201: Which of the following are separate flows Q206: In the circular flow model, producers Q220: Households _ final goods and services in Q383: Which of the following statements about an
![]()
A)sell goods
Unlock this Answer For Free Now!
View this answer and more for free by performing one of the following actions

Scan the QR code to install the App and get 2 free unlocks

Unlock quizzes for free by uploading documents