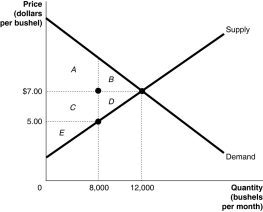
The graph below represents the market for lychee nuts.The equilibrium price is $7.00 per bushel,but the market price is $5.00 per bushel.Identify the areas representing consumer surplus,producer surplus,and deadweight loss at the equilibrium price of $7.00 and at the market price of $5.00.
Correct Answer:
Verified
Consu...
View Answer
Unlock this answer now
Get Access to more Verified Answers free of charge
Q63: Table 4-3 Q64: Table 4-3 Q69: Table 4-3 Q108: Government intervention in agricultural markets in the Q109: Rent control is an example of Q110: Economists refer a to a market where Q123: Which term refers to a legally established Q129: In order to be binding, a price Q134: Figure 4-5 Q219: Table 4-7 Unlock this Answer For Free Now! View this answer and more for free by performing one of the following actions Scan the QR code to install the App and get 2 free unlocks Unlock quizzes for free by uploading documents
![]()
![]()
![]()
A)a subsidy
![]()
![]()

