Multiple Choice
Figure 3-3 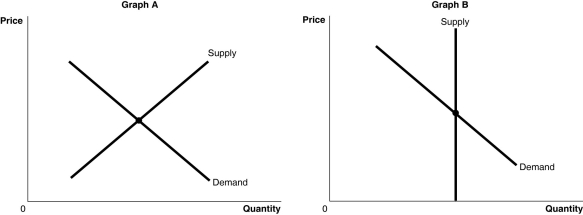
-Refer to Figure 3-3.The figure above shows the supply and demand curves for two markets: the market for original Michelangelo sculptures and the market for Ray Ban sunglasses.Which graph most likely represents which market?
A) Graph B represents the market for original Michelangelo sculptures and Graph A represents the market for Ray Ban sunglasses.
B) Graph A represents the market for original Michelangelo sculptures and Graph B represents the market for Ray Ban sunglasses.
C) Graph A represents both the market for original Michelangelo sculptures and Ray Ban sunglasses.
D) Graph B represents both the market for original Michelangelo sculptures and Ray Ban sunglasses.
Correct Answer:
Verified
Related Questions

