Figure 4-3
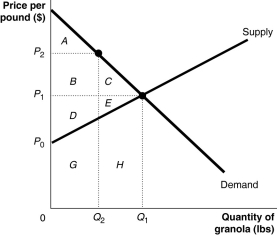
Figure 4-3 shows the market for granola. The market is initially in equilibrium at a price of P₁ and a quantity of Q₁. Now suppose producers decide to cut output to Q₂ in order to raise the price to P₂.
-Refer to Figure 4-3. What area represents producer surplus at P₂?
A) A + B + D
B) B + D
C) B + D + G
D) B + C + D + E
Correct Answer:
Verified
Q42: Figure 4-3 Q62: The sum of consumer surplus and producer Q67: Deadweight loss refers to Q79: Economic surplus is maximized in a competitive Q88: Equilibrium in a competitive market results in Q89: Figure 4-4 Q97: If,in a competitive market,marginal benefit is greater Q98: Economic efficiency is achieved when there is Q99: In a competitive market when there is Q100: Figure 4-4 Unlock this Answer For Free Now! View this answer and more for free by performing one of the following actions Scan the QR code to install the App and get 2 free unlocks Unlock quizzes for free by uploading documents
![]()
A)the opportunity cost to![]()
![]()

