Figure 4-3
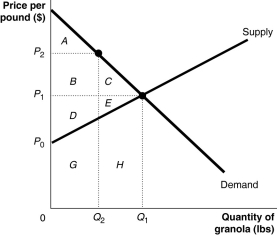
Figure 4-3 shows the market for granola. The market is initially in equilibrium at a price of P₁ and a quantity of Q₁. Now suppose producers decide to cut output to Q₂ in order to raise the price to P₂.
-Refer to Figure 4-3. What area represents the deadweight loss at P₂?
A) C + E + H
B) G + H
C) C + E
D) B + C
Correct Answer:
Verified
Q24: The willingness of consumers to buy a
Q32: Figure 4-1 Q41: The difference between the lowest price a Q42: Figure 4-3 Q60: Producer surplus is the difference between the Q64: In a competitive market equilibrium the _ Q67: Deadweight loss refers to Q79: Economic surplus is maximized in a competitive Q97: If,in a competitive market,marginal benefit is greater Q98: Economic efficiency is achieved when there is![]()
![]()
A)the opportunity cost to
Unlock this Answer For Free Now!
View this answer and more for free by performing one of the following actions

Scan the QR code to install the App and get 2 free unlocks

Unlock quizzes for free by uploading documents