Multiple Choice
Table 20-1
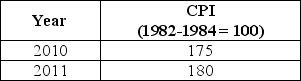
-Refer to Table 20-1.Suppose that the data in the table above reflect price levels in the economy.What is the inflation rate between 2010 and 2011?
A) 2.9%
B) 3.5%
C) 4.6%
D) 5%
E) 7.5%
Correct Answer:
Verified
Related Questions

