Table 20-2
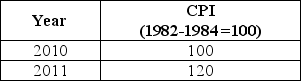
-Refer to Table 20-2.Suppose that the data in the table above reflect the price levels in the economy.What is the inflation rate in between 2010 and 2011?
A) 2%
B) 5%
C) 10%
D) 12%
E) 20%
Correct Answer:
Verified
Q87: Monthly expenditures for a family of 4
Q181: When the price of gasoline rises,some consumers
Q186: The PPI is the
A)price parity index.
B)prime producer
Q187: Most economists believe that biases cause changes
Q188: If consumers purchase fewer of those products
Q190: The inflation rate measures the percentage increase
Q192: If the CPI falls from 142 to
Q195: If the CPI rises from 206.7 to
Q199: In 1986,an Apple IIe computer with 65
Q200: What does the PPI measure?
A)the average change
Unlock this Answer For Free Now!
View this answer and more for free by performing one of the following actions

Scan the QR code to install the App and get 2 free unlocks

Unlock quizzes for free by uploading documents