Figure 26-3
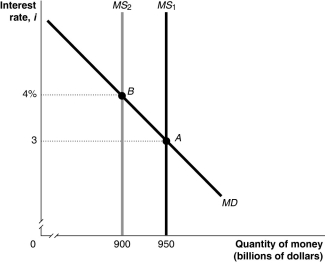
-Refer to Figure 26-3.In the figure above,the movement from point A to point B in the money market would be caused by
A) an increase in the price level.
B) a decrease in real GDP.
C) an open market sale of Treasury securities by the Federal Reserve.
D) a decrease in the required reserve ratio by the Federal Reserve.
Correct Answer:
Verified
Q35: Figure 26-4 Q50: When the price of a financial asset Q55: The money supply curve is vertical if Q62: The money market model is concerned with Q69: If the Fed buys Treasury bills,this will Q77: Describe how the Fed uses open market Q85: Buying a house during a recession may Q90: Rising nominal GDP will increase the demand Q92: Ceteris paribus,an increase in the money supply Q94: Give an example of a monetary policy
![]()
A)banks
Unlock this Answer For Free Now!
View this answer and more for free by performing one of the following actions

Scan the QR code to install the App and get 2 free unlocks

Unlock quizzes for free by uploading documents