Figure 26-6
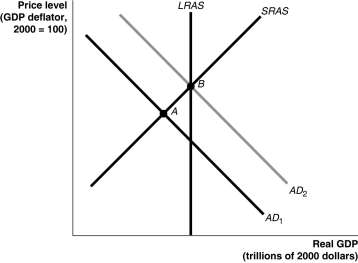
-Refer to Figure 26-6.In the figure above suppose the economy is initially at point A.The movement of the economy to point B as shown in the graph illustrates the effect of which of the following policy actions by the Federal Reserve?
A) a decrease in income taxes
B) an increase in the required reserve ratio
C) an open market purchase of Treasury bills
D) an open market sale of Treasury bills
Correct Answer:
Verified
Q41: Figure 26-5 Q61: The federal funds rate is Q63: Which of the following correctly describes what Q120: Lowering the interest rate will Q124: In which of the following situations would Q126: Falling interest rates can Q128: When the Fed increases the money supply Q130: If the Fed pursues expansionary monetary policy Q133: Contractionary monetary policy causes Q134: If the Fed's policy is contractionary,it will
![]()
A)the interest rate
A)decrease spending on
A)increase a firm's stock
A)the
A)aggregate
A)aggregate demand to rise
A)use
Unlock this Answer For Free Now!
View this answer and more for free by performing one of the following actions

Scan the QR code to install the App and get 2 free unlocks

Unlock quizzes for free by uploading documents