Figure 26-7
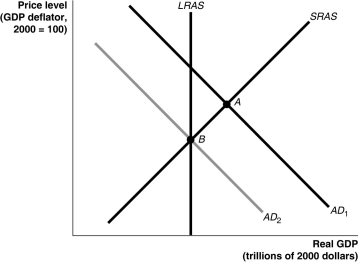
-Refer to Figure 26-7.In the figure above,suppose the economy is initially at point A.The movement of the economy to point B as shown in the graph illustrates the effect of which of the following policy actions by the Federal Reserve?
A) an increase in income taxes
B) a decrease in the required reserve ratio
C) an open market purchase of Treasury bills
D) an open market sale of Treasury bills
Correct Answer:
Verified
Q62: Table 26-2 Q111: An increase in the domestic interest rate Q111: When the Fed decided to buy long-term Q119: When the Fed embarked on a policy Q121: If the Fed pursues expansionary monetary policy Q122: If the Fed raises its target for Q132: Which of the following situations is one Q137: If money demand is extremely sensitive to Q139: Which of the following characterizes the Fed's Q156: When calculating GDP,the Bureau of Economic Analysis
![]()
Unlock this Answer For Free Now!
View this answer and more for free by performing one of the following actions

Scan the QR code to install the App and get 2 free unlocks

Unlock quizzes for free by uploading documents