Figure 27-8
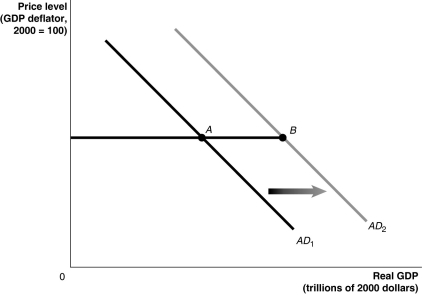
-Refer to Figure 27-8.If government purchases increase by $100 billion and lead to an ultimate increase in aggregate demand as shown in the graph below,the difference in real GDP between point A and point B will be
A) $100 billion.
B) less than $100 billion.
C) more than $100 billion.
D) There is insufficient information given here to draw a conclusion.
Correct Answer:
Verified
Q103: Table 27-4 Q108: Table 27-2 Q108: To combat inflation,Congress and the president should Q109: Expansionary fiscal policy _ the price level Q111: Table 27-1 Q111: An appropriate fiscal policy response when aggregate Q112: If policymakers are concerned that the economy Q120: What are the key differences between how Q138: Table 27-5 Q142: The multiplier effect is the series of Unlock this Answer For Free Now! View this answer and more for free by performing one of the following actions Scan the QR code to install the App and get 2 free unlocks Unlock quizzes for free by uploading documents
![]()
![]()
A)decrease
![]()
![]()

