Figure 28-2
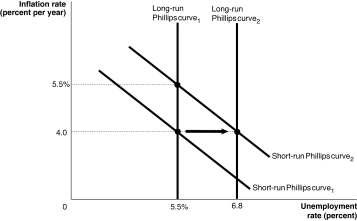
-Refer to Figure 28-2.The shifts shown in the short-run and long-run Phillips curves between period 1 and period 2 could be explained by
A) an increase in the expected inflation rate from 4.0 to 5.5 percent.
B) an increase in the natural rate of unemployment from 5.5 to 6.8 percent.
C) either an increase in expected inflation from 4.0 to 5.5 percent or an increase in the natural rate of unemployment from 5.5 to 6.8 percent.
D) None of the above are correct.
Correct Answer:
Verified
Q37: If the long-run aggregate supply curve is
Q42: Figure 28-2 Q44: A decrease in cyclical unemployment will Q45: Figure 28-4 Q70: The _ curves are both vertical. Q104: If expected inflation falls,the long-run Phillips curve Q105: In the 1960s,many economists and policy makers Q110: Ceteris paribus,an increase in the current or Q110: What actions could the Federal Reserve take Q116: Where does the short-run Phillips curve intersect
![]()
A) shift
![]()
A)aggregate demand
Unlock this Answer For Free Now!
View this answer and more for free by performing one of the following actions

Scan the QR code to install the App and get 2 free unlocks

Unlock quizzes for free by uploading documents