Figure 28-3
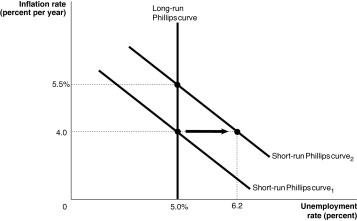
-Refer to Figure 28-3.Consider the shift in the short-run Phillips curves shown in the above graph. This shift may be explained by
A) an increase in the natural rate of unemployment from 5.0 to 6.2 percent.
B) an increase in the expected rate of inflation from 4.0 to 5.5 percent.
C) either an increase in the natural rate of unemployment from 5.0 to 6.2 percent or an increase in the expected rate of inflation from 4.0 to 5.5 percent.
D) None of the above are correct.
Correct Answer:
Verified
Q56: In the long run,the Phillips curve is
Q65: If the economy is producing _,unemployment is
Q70: The _ curves are both vertical.
A)aggregate demand
Q72: A decrease in aggregate demand will
A)cause inflation.
B)decrease
Q76: In the short run,the Federal Reserve can
Q89: If workers and firms raise their inflation
Q110: What actions could the Federal Reserve take
Q116: Where does the short-run Phillips curve intersect
Q121: Which of the following would decrease the
Q123: Monetary policy has _ impact on the
Unlock this Answer For Free Now!
View this answer and more for free by performing one of the following actions

Scan the QR code to install the App and get 2 free unlocks

Unlock quizzes for free by uploading documents