Multiple Choice
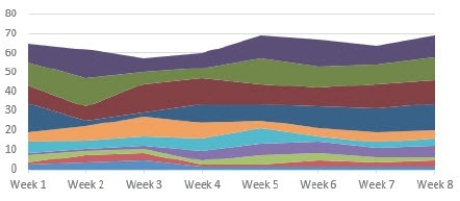
The chart shown above depicts a(n) ________ chart.
A) Line
B) Scatter
C) Radar
D) Area
Correct Answer:
Verified
Related Questions
Q1: To show changes over time,you would use
Q2: A _ chart is used to shows
Q4: A(n)_ chart is useful for showing categories
Q5: To illustrate the relationship of the parts
Q6: Which of the following is NOT one
Unlock this Answer For Free Now!
View this answer and more for free by performing one of the following actions

Scan the QR code to install the App and get 2 free unlocks

Unlock quizzes for free by uploading documents