Use the following diagram to answer the following questions.
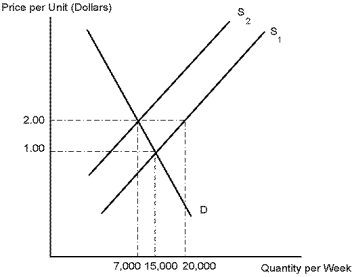
-Refer to Diagram 4-3. Suppose supply decreases from S₁ to S₂. How much does total revenue change?
A) increases by $10,000.
B) decreases by $10,000.
C) increases by $1,000.
D) decreases by $1,000.
Correct Answer:
Verified
Q109: Suppose that the price of a substitute
Q110: Use the following diagram to answer the
Q111: Use the following diagram to answer the
Q112: Use the following diagram to answer the
Q113: Suppose the market price of hamburger is
Q115: Suppose there is an increase in income
Q116: Use the following diagram. Suppose an advance
Q117: Use the following diagram to answer the
Q118: Use the following diagram to answer the
Q119: Suppose the technology of wool production improves.
Unlock this Answer For Free Now!
View this answer and more for free by performing one of the following actions

Scan the QR code to install the App and get 2 free unlocks

Unlock quizzes for free by uploading documents