Use the following diagram to answer the following questions.
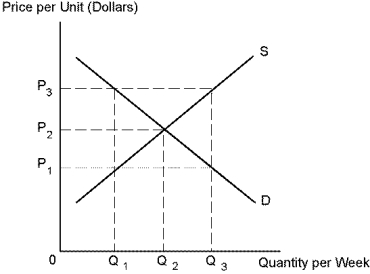
-Refer to Diagram 4-4. Suppose there is a price support of P₃. The quantity of output demanded by consumers will be:
A) Q₁.
B) Q₂.
C) Q3.
D) somewhere between Q₁ and Q₂.
Correct Answer:
Verified
Q128: Use the following diagram to answer the
Q128: Use the following diagram to answer the
Q129: Use the following diagram to answer the
Q130: Regulations designed to enhance the profits earned
Q131: Suppose supply increases from S₁ to S₂.
Q132: Suppose that instead of being concerned about
Q133: "The price of chicken is 10 percent
Q134: "If next year's harvest of corn fell
Q135: Use the following diagram to answer the
Q136: An unusually good harvest causes the price
Unlock this Answer For Free Now!
View this answer and more for free by performing one of the following actions

Scan the QR code to install the App and get 2 free unlocks

Unlock quizzes for free by uploading documents