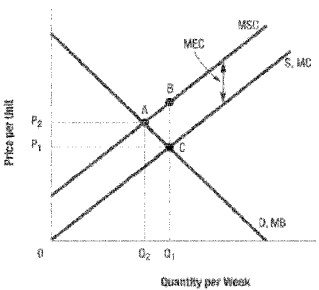
Use the following diagram to answer the following questions.
-Use the following diagram. The total net efficiency loss from government rent controls is given by area: 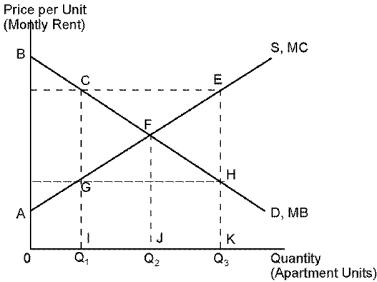
A) CFG.
B) ABF.
C) FEH.
D) CFE.
Correct Answer:
Verified
Q37: Which of the following is an example
Q38: Use the following diagram to answer the
Q39: Use the following information to answer the
Q40: Use the following diagram to answer the
Q41: Moneymakers Incorporated currently produces 100 units of
Q43: Use the following diagram to answer the
Q44: Use the following diagram to answer the
Q45: Use the following diagram to answer the
Q46: Use the following diagram to answer the
Q47: Use the following diagram to find the
Unlock this Answer For Free Now!
View this answer and more for free by performing one of the following actions

Scan the QR code to install the App and get 2 free unlocks

Unlock quizzes for free by uploading documents