Use the following diagram to answer the following questions.
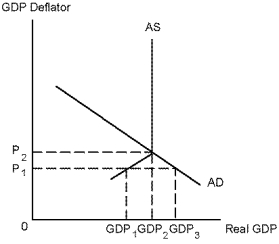
-Refer to Diagram 12-1. Suppose the price level in the above graph is currently P₁. In this instance, the economy would most likely be experiencing:
A) a depression.
B) recession.
C) an excess supply of goods and services.
D) an excess demand for goods and services.
Correct Answer:
Verified
Q83: During the past quarter real GDP increased
Q84: Suppose the wage rate decreases. As a
Q85: Use the following diagram to answer the
Q86: Suppose the GDP deflator is currently 115
Q87: Use the following diagram to answer the
Q89: During the past three quarters real GDP
Q90: Suppose the GDP deflator is currently 121
Q91: A change in technology will cause:
A) a
Q92: Use the following diagram to answer the
Q93: Use the following diagram to answer the
Unlock this Answer For Free Now!
View this answer and more for free by performing one of the following actions

Scan the QR code to install the App and get 2 free unlocks

Unlock quizzes for free by uploading documents