Use the following diagram to answer the following questions.
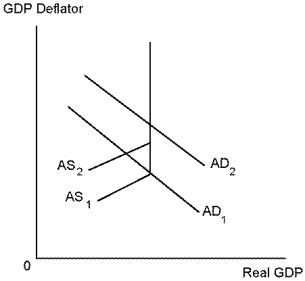
-Refer to Diagram 14-2. In the above diagram, which of the following illustrates inflation caused by reduction in production of oil?
A) a shift in aggregate demand from AD₁ to AD₂.
B) a shift in aggregate demand from AD₂ to AD₁.
C) a shift in aggregate supply from AS₂ to AS₁.
D) a shift in aggregate supply from AS₁ to AS₂.
Correct Answer:
Verified
Q83: Use the following diagram to answer the
Q84: Suppose the GDP deflator was 120 in
Q85: Evaluate the following statement. "During the past
Q86: Given the information in the following table,
Q87: Suppose the GDP deflator in 1997 was
Q89: Use the following diagram to answer the
Q90: Suppose the annual growth rate in real
Q91: Suppose the CPI is currently 147. If
Q92: Evaluate the following statement. "If incomes policies
Q93: "Inflationary policies followed by the government helped
Unlock this Answer For Free Now!
View this answer and more for free by performing one of the following actions

Scan the QR code to install the App and get 2 free unlocks

Unlock quizzes for free by uploading documents