Multiple Choice
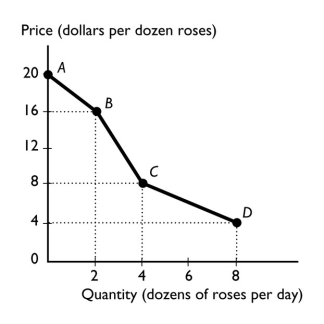
-The figure above shows the relationship between the price of a dozen roses and the quantity of roses a florist can sell.The slope between points A and B is
A) 20.
B) 16.
C) 2.
D) 4
E) nonexistent because at point A, 0 roses are sold.
Correct Answer:
Verified
Related Questions
Q245: Q252: Q253: Q264: Ceteris paribus when graphing a relationship refers Q267: We are investigating the relationship among three Unlock this Answer For Free Now! View this answer and more for free by performing one of the following actions Scan the QR code to install the App and get 2 free unlocks Unlock quizzes for free by uploading documents![]()
![]()
![]()

