Multiple Choice
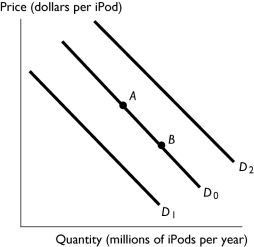
-The figure above shows the market for iPods.Which of the following shifts the demand curve from D₀ to D₂?
A) A decrease in the price of Zunes, a substitute for iPods.
B) An increase in the price of iPods.
C) A requirement that all students at universities have an iPod.
D) A decrease in the price of iPods.
E) A decrease in people's incomes if iPods are a normal good.
Correct Answer:
Verified
Related Questions

