Multiple Choice
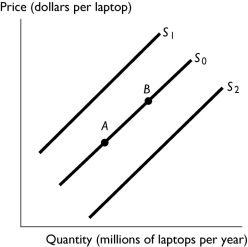
-The above figure shows the market for laptops.Which of the following shifts the supply curve from S₀ to S₁?
A) An increase in the cost of hard drives.
B) A decrease in the price of laptops.
C) An increase in the number of laptop manufactures and sellers.
D) An increase in the price of laptops.
E) An increase in the productivity of the workers manufacturing laptops.
Correct Answer:
Verified
Related Questions

