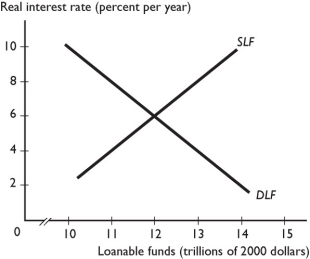
-The figure above shows the loanable funds market.The equilibrium real interest rate is ________ and the equilibrium quantity of loanable funds is ________.
A) 6 percent; $2.0 trillion
B) 4 percent; $2.5 trillion
C) 8 percent; $1.5 trillion
D) 0 percent; $3.5 trillion
E) 4 percent; $1.5 trillion
Correct Answer:
Verified
Q148: A decrease in expected profit
A) lowers the
Q149: At the current interest rate, the quantity
Q150: If a surplus of loanable funds exists
Q151: In the loanable funds market, if the
Q152: Q154: Suppose firms become more optimistic about the Q155: Other things remaining the same, a _![]()
Unlock this Answer For Free Now!
View this answer and more for free by performing one of the following actions

Scan the QR code to install the App and get 2 free unlocks

Unlock quizzes for free by uploading documents