10.4 Chapter Figures
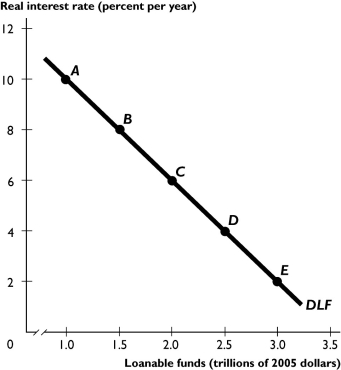
The figure above shows the demand for loanable funds curve.
-In the figure above, a movement from point A to point C can be the result of
A) an increase in expected profit.
B) a decrease in expected profit.
C) a rise in the real interest rate.
D) a fall in the real interest rate.
E) an increase in the government budget deficit.
Correct Answer:
Verified
Q210: Q211: The Ricardo-Barro effect is based on the Q212: Q213: As a result of the government's rescue Q214: Suppose the government has a budget surplus.Then Q216: The "crowding-out effect" refers to how a Unlock this Answer For Free Now! View this answer and more for free by performing one of the following actions Scan the QR code to install the App and get 2 free unlocks Unlock quizzes for free by uploading documents
A)

