Multiple Choice
10.4 Chapter Figures
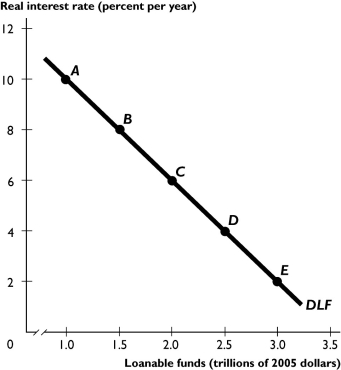
The figure above shows the demand for loanable funds curve.
-If the demand curve for loanable funds shifts rightward from the curve shown in the figure above, the shift could be the result of
A) an increase in expected profit.
B) a decrease in expected profit.
C) a rise in the real interest rate.
D) a fall in the real interest rate.
E) a decrease in real GDP.
Correct Answer:
Verified
Related Questions
Q196: Q197: Suppose the government's budget deficit increases by Q198: The crowding-out effect implies that a government Unlock this Answer For Free Now! View this answer and more for free by performing one of the following actions Scan the QR code to install the App and get 2 free unlocks Unlock quizzes for free by uploading documents

