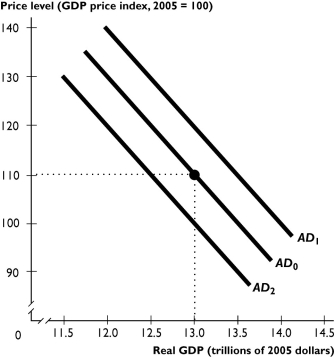
The figure above shows aggregate demand curves.
-Based on the figure above, the aggregate demand curve will shift from AD₀ to AD₂ when
A) potential GDP increases.
B) the price level falls.
C) the price level rises.
D) government expenditure decreases.
E) taxes are lowered.
Correct Answer:
Verified
Q211: When cost-push inflation starts,real GDP _ and
Q221: An increase in investment _ aggregate demand,the
Q222: An inflationary gap is created when
A)real GDP
Q226: Stagflation is a combination of _ real
Q232: If the quantity of real GDP supplied
Q234: As a result of OPEC _ oil
Unlock this Answer For Free Now!
View this answer and more for free by performing one of the following actions

Scan the QR code to install the App and get 2 free unlocks

Unlock quizzes for free by uploading documents