Multiple Choice
14.5 Chapter Figures
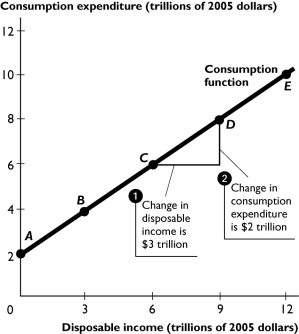
The above figure shows a nation's consumption function.
-Using this consumption function, the marginal propensity to consume is
A) 0.
B) $1.5 trillion.
C) $2 trillion.
D) 1.33.
E) 0.75.
Correct Answer:
Verified
Related Questions
Q248: A movement along the AE curve arises
Q249: When the price level increases, aggregate planned
Q250: Investment decreases by $300 billion, government expenditure

