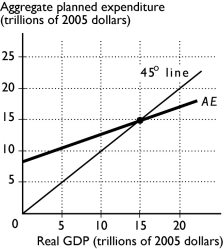
-The above figure shows the AE curve and 45° line for an economy.
a. If real GDP equals $10 trillion, how do firms' inventories compare to their planned inventories?
b. If real GDP equals $20 trillion, how do firms' inventories compare to their planned inventories?
c. What is the equilibrium level of expenditure?
Why is this amount the equilibrium?
Correct Answer:
Verified
View Answer
Unlock this answer now
Get Access to more Verified Answers free of charge
Q296: What is the relationship between the slope
Q298: Q301: What is the relationship between the aggregate Q302: Suppose an economy has no income taxes Q304: "A country's expenditure multiplier is constant over Q403: How do firms respond to unplanned inventory Q408: Suppose that firms find that their inventories Q411: "If aggregate planned expenditure exceeds real GDP, Q427: Explain what happens to equilibrium expenditure if Q435: Discuss the relationship between the business cycle
Unlock this Answer For Free Now!
View this answer and more for free by performing one of the following actions

Scan the QR code to install the App and get 2 free unlocks

Unlock quizzes for free by uploading documents